
Dr Joanna Dipnall is an applied statistician with interests in the advanced statistical methods, including machine learning and deep learning techniques. She completed her Honours in Econometrics with Monash University and her PhD with IMPACT SRC, School of Medicine, Deakin University. Joanna works extensively with registry and linked medical data and collaborates extensively with the Faculty of IT at Monash to supervise Masters and PhD students to integrate artificial intelligence within health research. Joanna teaches within the Monash Biostatistics Unit and is the Unit Co-coordinator for the Monash Masters of Health Data Analytics course. Joanna has taught advanced statistical methods for many years at universities and for ACSPRI.
The aim of the course is to provide the participants with understanding multivariate analysis sufficient to determine the appropriate technique for a given problem, format data as required for analysis, run the analysis using the Stata statistical program, and interpret the results.
Stata is a comprehensive integrated package for data management, analysis and graphics. Sample datasets will be provided but participants are encouraged to bring some of their own Stata data for analysis. Teaching and practice will be closed and intergrated, and individual assistance will be provided as needed.
This course is suitable for researchers
Day 1
Overview of Multivariate analysis: An introduction to multivariate analysis and the different issues.
Issues with data: There are many issues analysts face when deciding on the appropriateness of different multivariate analysis techniques. A brief introduction to these issues and discussion of data integration, missing data, and an introduction to Stata's multiple imputation techniques.
Multiple Regression: Multiple regression analysis is often used to model the relationship between a single dependent interval variable with several varying types of independent variables. This technique is often used in economics for prediction and forecasting (e.g. national economy), and in social research for evaluating what determines an effective program (e.g. the best predictors of success in high-school), or determining which personality variable best predicts a social trait.
Day 2
Canonical correlation: Canonical correlation is used to investigate the relationship between two sets of variables. One set contains two or more dependent variables and the other set contains two or more independent variables. For example, it has been used to investigate the relationship between a number of risk factors to a group of symptoms in social research.
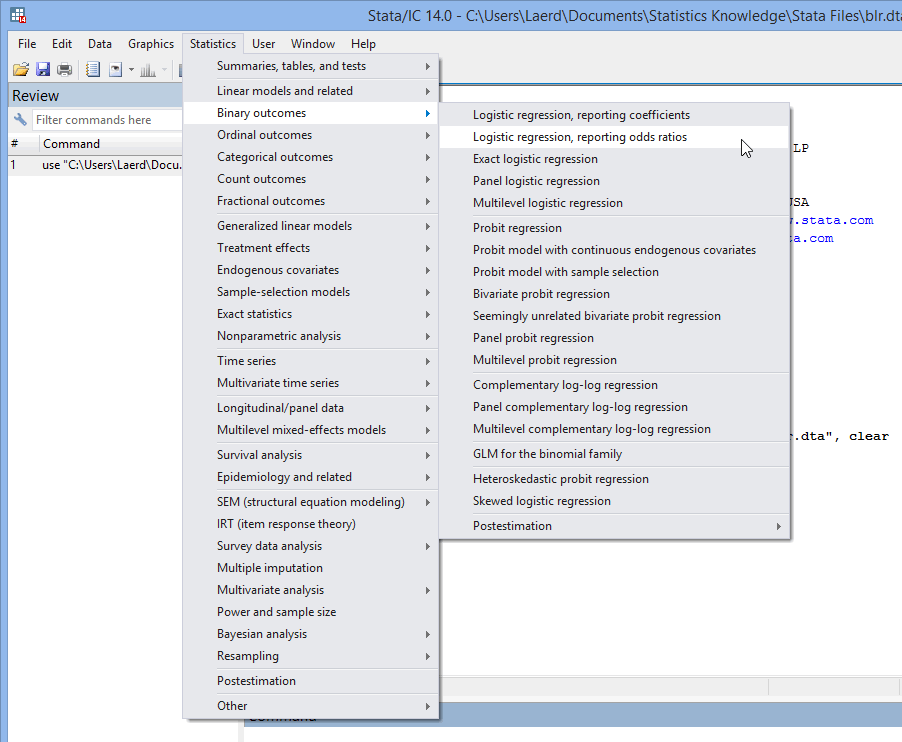
Binary Logistic Regression: Binary logistic regression is used when there is a binary dependent variable and several varying types of independent variables. Logit analysis is used to predict the probability of an event in the dependent variable. The analysis is used widely in health research where the dependent variable is the outcome of a disease or health condition (e.g. lung cancer), or in social research where the outcome is a certain event, (e.g. employment status).
Ordinal Logistic Regression: Ordinal logistic regression is used when there is an ordinal dependent variable and several varying types of independent variables. Logit analysis is used to predict the probability of an event in the dependent variable.
Day 3
Survival analysis: Survival analysis data deals with the outcome being the waiting time until the occurrence of a well-defined event. Observations are censored, in the sense that for some units the event of interest has not occurred at the time the data are analysed and explanatory variables are used to control for the effect on the waiting time. The point of survival analysis is to follow subjects over time and observe at which point in time they experience the event of interest (e.g. cancer). Survival analysis is often referred to as time to event analysis, mainly used in biomedical sciences where the interest is in observing time to death. However, over the past few years this analysis has been extended to other areas of research such as the social sciences (e.g. forensic analysis, employment analysis, marriage) and even engineering sciences (e.g. failure time analysis).
Principal components and factor analysis: Principal components analysis is an exploratory technique used to produce a smaller number of artificial variables (called principal components) that will account for most of the variance in the originally observed variables. It is also often used to uncover unknown trends in data. The principal components may then be used as predictor or criterion variables in subsequent analyses. For example, a large number of highly correlated measures for job satisfaction can be transformed into a smaller set of uncorrelated principal components that are then used for subsequent analysis (e.g. regression analysis).
Exploratory Factor analysis: Exploratory Factor analysis is used to obtain distinct new variables of factors. Factor analysis looks at the interrelationships among a large number of variables and explains them in terms of their underlying factors or dimensions. This technique is often used in social science to measure a trait that cannot be measured directly (e.g. self-esteem).
Day 4
Discriminant analysis: Discriminant analysis is used to study the differences between two or more groups with respect to several variables simultaneously. It can be used to understand differences in groups so as to predict the likelihood that an individual belongs to a certain group. For example, investigating which background variables discriminate between patients likely to recover fully, partially or not at all.
Cluster analysis: Cluster analysis is an exploratory technique that uses a number of different algorithms and methods to combine observations into previously unknown mutually exclusive natural groups or clusters based on specific similarities. For example, social researchers have used this technique to produce unique groups based on socio-economic profiles.
Multidimensional scaling: Multidimensional scaling for two way data is a data dimension-reduction and visualization technique that looks at dissimilarities between observations based on certain characteristics. Distance measures of similarity and dissimilarity are used to produce graphs of relative positioning. For example, researchers have reviewed how close American universities are to each other, reviewing the differences between private and public universities.
Day 5
Correspondence analysis: Simple correspondence analysis provides graphical representations of two-way frequency tables to improve the researcher’s understanding of any similarities and associations between the variables. Thus, it is especially good for the analysis of large contingency tables. For example, it could be used to investigate various crimes across the different states.
Group exercise: This is a final set of group exercises for the participants to apply their knowledge to a set of analytical problems.
This course may run in a computer lab, or you may be advised to bring your own laptop with specified software including Stata.
We will let you know in advance.
Notes and sample datasets will be provided, but you are encouraged to bring some of your own own Stata data for analysis for the group exercise.
Participants should have completed an intermediate statistics course covering at least some of the syllabus of Data Analysis using Stata. Stata will be available, and experience with Stata will be assumed (e.g. use of Stata’s Do files).
No specific references are suggested although participants are encouraged to bring any Stata documentation they may have. For an overview of the Stata package, please visit http://survey-design.com.au or http://stata.com.
Q: Was this course named something else?
A: yes this course used to be called 'Applied Multivariate Analysis Using Stata'
Q: Do I have to have any prerequisites to do this course?
A: Please check the recommended background section for details.
It served as a helpful exposure to a wide range of statistical techniques (Summer 2015)
Covered some new things that I hadn’t known about before (Summer 2015)
Theory & pracs good - lots of emphasis on pre & post testing of data before analysis !!! great. (Summer 2014)
Syntax, course notes, broad coverage, so very helpful. (Summer 2014)
Exposure to someone who really knows her stuff. (Summer 2014)
catered to diff students but seemed to suit all our levels. We all got what we needed out of it. (Summer 2014)
Stata is distributed in Australia and New Zealand by Survey Design and Analysis Services.